
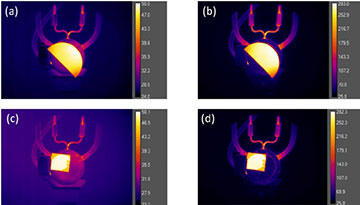
An infrared image of the fused silica window used to test the depth thermography concept. [Image: Courtesy of Mikhail Kats]
All objects with a temperature greater than absolute zero generate thermal radiation, although it remains largely invisible to the naked eye. Infrared thermography transforms thermal emission information into a visible image that reveals the temperature distribution of a given surface.
Now, researchers at the University of Wisconsin-Madison, USA, have taken infrared thermography a step further with a new method that can create a three-dimensional map of the temperatures inside an object (ACS Photonics, doi: 10.1021/acsphotonics.9b01588). The technique, which they call depth thermography, uses the measured spectrum of thermal emission to extract its temperature as a function of depth.
Although it only works for materials that are semi-transparent at some wavelength region in the infrared, the team foresees applications for depth thermography in semiconductor device manufacturing, glass and plastic production, and the monitoring of liquids and gases.
Improving precision and accuracy
For the last five years, Mikhail Kats and his colleagues have worked on improving the accuracy of thermal emission measurements in their lab—a task made difficult by the confounding nature of background emission from the environment and even the instrumentation itself. As the quality of their data improved, the researchers thought about applying what they had learned to create better sensing technology.
“Our measurement capability is now accurate enough and precise enough that we can begin to discern contributions to thermal radiation from the surface of an object and regions below the surface,” said Kats, a professor of electrical and computer engineering at the University of Wisconsin-Madison.
While a technique called multifrequency microwave radiometry is also capable of noninvasive 3D temperature profiling, its lateral resolution is limited to a few centimeters at best. Depth thermography, on the other hand, has a resolution on the order of tens of microns.
From proof-of-concept to future applications
The thermal emission spectrum, as measured by a Fourier-transform spectrometer in their experiment, is made up of contributions from different depths. Each contribution is determined by the local temperature and optical properties. Using this concept, Kats and his colleagues created a temperature-retrieval algorithm that extracts the temperature profile at different depths from the spectrum.
As a proof-of-concept experiment, the researchers measured the 3D temperature distribution of a 1-mm-thick slab of fused silica placed on top of a heated surface. They collected thermal emission spectra from the slab, as well as from a carbon nanotube blackbody reference, at 100, 200 and 300 °C. The slab was then modeled as a thin-film stack, with each layer having a different temperature. The results agreed with expectations about temperature distribution given the geometry and optical properties of the sample.
Next, Kats would like to incorporate machine learning into the temperature-retrieval algorithm and also perform additional experiments to test the technique for future applications.
“We are interested in using depth thermography to measure the temperature distribution of electronic and optoelectronic semiconductor devices to identify overheating within the devices,” said Kats. “We also plan to use depth thermography to perform mapping of temperature throughout the volumes of high-temperature gases and liquids.”