
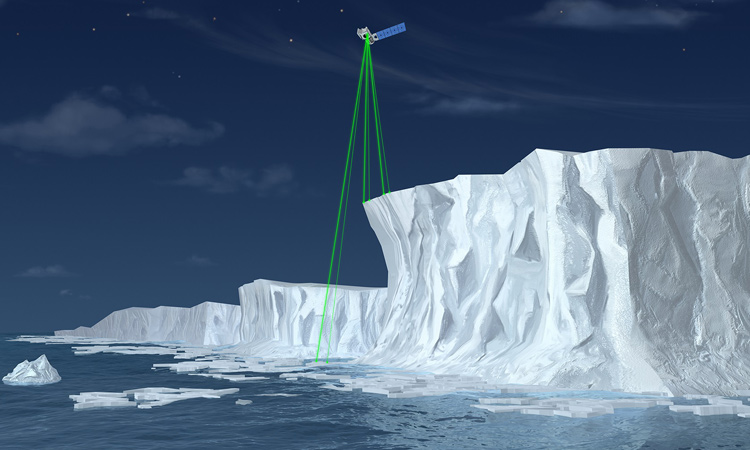
 Illustration of NASA’s Ice, Cloud, and land Elevation Satellite-2 (ICESat-2), a mission to measure the changing height of Earth’s ice. [NASA]
Nearly every day brings news about climate change and its impacts, from wildfires in Greenland to melting ice on Antarctica to Europeans sweating through record-high summer temperatures. These stories, plus urgent warnings about rising sea levels and record amounts of greenhouse gases, can foster strong impulses to “do something.”
Today’s photonics researchers have risen to the call to quantify global climate and environmental change.
One of the first jobs, though, is to know the problem—and fortunately, today’s photonics researchers have risen to the call to quantify global climate and environmental change. From wind to ice, from treetops to coral reefs, today’s most sophisticated optical instruments are examining the condition of humanity’s home planet.
Photonic sensing of Earth’s environment falls into three broad categories. Laser ranging excels in quantifying how solids—such as ice sheets—increase or decrease in elevation. Hyperspectral imaging gathers full spectral data from each pixel in an image, revealing patterns of healthy and diseased life forms in their habitats. And, thanks to advances in portability, laser spectroscopy can fill in some crucial gaps in our knowledge of the distribution of problematic atmospheric gases. Many technologies work both for day-to-day weather sensing for meteorological models, and for tracking and assessment of longer-term climate trends.
Here’s a random sample of several research projects that are using optics and photonics to keep tabs on environmental change.
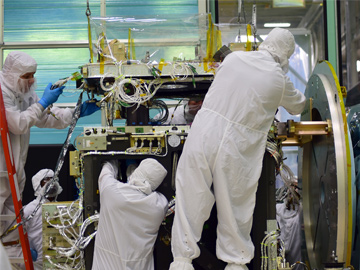 Atlas instrument being assembled inside a cleanroom at NASA Goddard, Greenbelt, Md., USA. [NASA]
ICESat-2: Eyes on frozen water
For nearly 50 years, the scientific community has been taking satellite images that reveal the horizontal extent of Earth’s ice sheets. The snow-covered ice reflects most wavelengths of light differently from open ocean and land, so its surface area has been easy to measure. “But we were pretty blind to that third dimension—how thick is that sea ice,” says Tom Neumann of NASA, the project scientist for ICESat-2, a lidar-equipped orbital platform that’s designed to make just such measurements.
“When we were designing the ICESat-2 mission, we knew we needed to do a good job measuring height changes in glaciers and ice sheets, but also measuring sea ice freeboard,” Neumann explains. Freeboard is the small portion of sea ice that rises above the ocean surface. (“Sea ice” is frozen sea water; icebergs are chunks of freshwater glaciers that have broken off and floated away.)
Scientists at the NASA Goddard Space Flight Center, Greenbelt, Md., USA, have plenty of experience with Earth-scanning lidar. The U.S. space agency first turned its laser eyes toward frozen water with the original ICESat spacecraft, which operated from 2003 to 2009, when its last working laser failed. Data from ICESat revealed that some of the glaciers flowing off the Greenland and Antarctic ice sheets were shrinking faster than expected, and that the melt from mountain glaciers and ice caps contributed one-third of the sea-level rise between 2004 and 2008.
By the time ICESat signed off, the first U.S. decadal survey on Earth science and applications, published in 2007, had already recommended a follow-on mission with more advanced capabilities. Neumann, now the project scientist for ICESat-2, has spent a decade translating those stated science objectives into hardware and data products for the lidar mission.
Like its predecessor, ICESat-2—which launched from California, USA, in September 2018—is in a near-polar orbit that gives its Advanced Topographic Laser Altimeter System (ATLAS) a view of each patch of Earth four times a year. But ATLAS focuses each of its six beams down to a much narrower footprint of roughly 17 m, compared with 70 to 100 m for the single beam of the earlier ICESat spacecraft, says Anthony J. Martino, the ATLAS instrument scientist at NASA Goddard. (Technically, the instrument’s specifications call for a divergence angle of 35 microradians, which translates to a beam width of 17 m from an orbital altitude of 500 km. Pre-launch testing revealed the angle to be closer to 22 microradians.)
The original ICESat experienced laser problems because its lidar was designed to fire high-energy (roughly 100 mJ) pulses at a relatively slow repetition rate of 40 Hz, Martino says. By contrast, the ATLAS diode-pumped solid-state lasers give off 1 mJ per pulse at a 10-kHz repetition rate. The low pulse energy led to the need for photon-counting detectors.
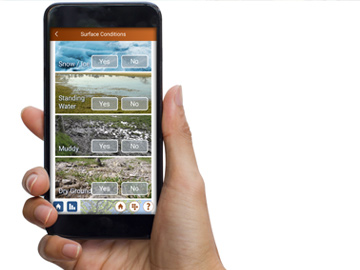 NASA’s GLOBE Observer app invites “citizen scientists” to capture local data for comparison with ICESat-2 measurements.
Like its predecessor, ICESat-2 was designed to measure ice sheet elevation as well as sea ice volume. Much of the time, however, the spacecraft is passing over regions that lack ice. So the NASA team has devised ways to measure the mass of forest vegetation by using ICESat-2 measurements of treetop heights and the altitude of the forest floor. (NASA even developed a “citizen science” tool for the GLOBE Observer smartphone app to capture local tree heights for comparison with ICESat-2 measurements.) ATLAS can also see through clear bodies of water to a depth of 30 m.
In May, NASA released its first set of ICESat-2 data products to the National Snow and Ice Data Center (Colorado, USA), the U.S. archive for such information. By midsummer, more than 800 users had downloaded nearly half a million data sets, according to Neumann.
More lidar projects
In between ICESat’s last gasp and the launch of ICESat-2, an airborne lidar and radar mission dubbed Operation IceBridge kept tabs on the polar regions for NASA. Planes carrying compact lidar and radar instruments for measuring ice height flew mainly over Alaska, Greenland and several of Canada’s Arctic islands in the north and the West Antarctic Ice Sheet in the south. U.S. scientists scheduled some “underflights” synchronized with orbital passes of the European Space Agency’s CryoSat-2 to validate the European spacecraft’s radar data. Operation IceBridge is winding down now that ICESat-2 is on the job.
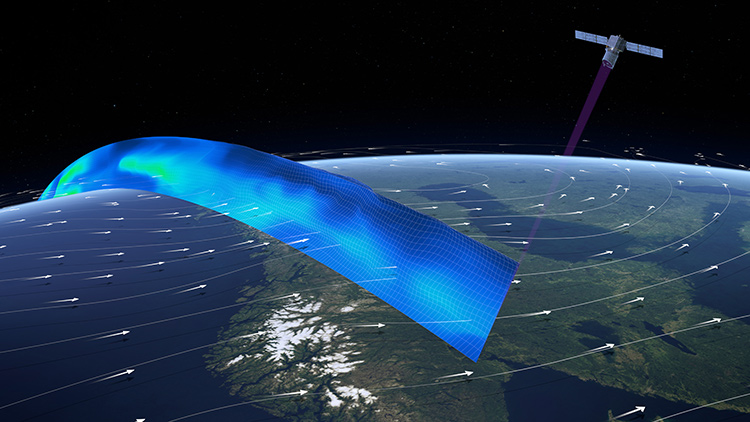 The ESA’s Aeolus spacecraft uses ultraviolet lidar for tracking wind speeds in Earth’s atmosphere. [ESA/ATG medialab]
While European altitude-measuring missions like CryoSat-2 and its predecessors have carried radar rather than lidar, in August 2018 ESA’s Living Planet Program launched an ultraviolet-lidar spacecraft named Aeolus for measuring Earth’s wind speeds. Air molecules and aerosols reflect a lot less total light than shiny solids, of course, but they do reflect more efficiently at the shorter wavelengths.
Formerly known as the Atmospheric Dynamics Mission (ADM), Aeolus transmits a beam from a 60-mJ, frequency-tripled, 355-nm Nd:YAG laser and picks up the bounceback with a combined, highly sensitive Mie and Rayleigh backscattering receiver and a 1.5-m-aperture Cassegrain telescope. The ESA spacecraft worked great for its first nine months orbit, then experienced dimming of its primary laser, and in early summer the Aeolus team switched over to the satellite’s backup laser.
Over its planned three-year mission, Aeolus is expected to act as a technology demonstration platform for future meteorological wind-speed lidars. Another European-Japanese spacecraft, EarthCARE (for Earth Clouds, Aerosols and Radiation Explorer), was announced more than 10 years ago for climate-change studies, but is still in the integration and testing phase, with launch now scheduled for 2021.
Scientists who use satellite-gathered data usually like to compare their results with information gathered by alternative means. Providing the “ground truth” for ESA’s Aeolus, and collecting data for additional research projects, are two U.S. airborne missions: the High Altitude Lidar Observatory (HALO) and the Doppler Aerosol Wind Lidar (DAWN), based at NASA Langley Research Center in Virginia, USA.
“Satellites are nice because they’re from space, you get global coverage, but you don’t have the temporal sampling that you would like,” says Amin Nehrir, HALO’s principal investigator at NASA Langley. “A satellite in polar orbit might repeat over the same ground track every 16 days, but that might not be sufficient for understanding the processes of mixing of forest-fire smoke into the upper troposphere.”
HALO, which began flying in April 2019, was designed as a much more compact and powerful replacement for a 25-year-old airborne lidar system that fit only on large research aircraft like the DC-8. The new instrument, the size of a mini-refrigerator, contains both high-spectral-resolution lidar and differential-absorption lidar (DIAL). In DIAL, the instrument measures reflections at two closely spaced wavelengths to home in on the spectral lines of the atmospheric gases of interest. The modular HALO package can be easily reconfigured for studies of methane, water vapor or particulate matter.
One spaceborne lidar system expressly designed to monitor the biosphere’s health is the Global Ecosystem Dynamics Investigator (GEDI), a collaboration between NASA Goddard and the University of Maryland, USA. Launched to the International Space Station in December 2018 for a planned two-year mission, GEDI carries three 242-Hz-pulsed Nd:YAG lasers emitting 10 mJ at a wavelength of 1064 nm. With a beam divergence of 56 milliradians, the instrument measures forest canopy heights within a footprint 25 m wide. GEDI’s science goals include quantifying the carbon balance between Earth’s atmosphere and its forests.
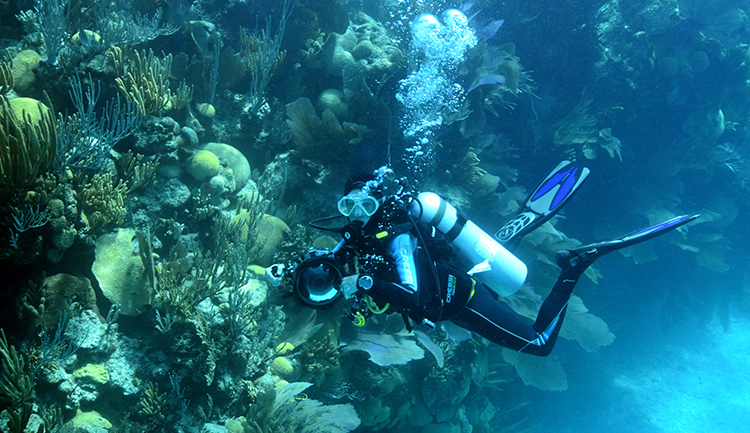 Bermuda Institute for Ocean Sciences postdoctoral fellow Yvonne Sawall conducts a scuba reef survey at North Rock, Bermuda. [Bermuda Institute of Ocean Sciences]
Hyperspectral portraits of coral reefs
Coral reefs—vast underwater ecosystems centered around the hard skeletons of tiny marine corals—support more than a million species of marine life. Humans benefit from healthy coral reefs that act as natural coastal storm barriers, provide jobs in the fishing and tourism industries, and possibly even provide raw materials for medicines yet to be discovered. Some call the reefs “rainforests of the sea.”
When the individual coral organisms in a reef are stressed for any reason, most often due to a temperature increase in their surrounding water, they expel the photosynthetic algae, called zooxanthellae, that live symbiotically with the corals and provide the larger organisms with nutrients and coloration. Once that happens, the bleached corals don’t have long to live unless the stress is relieved and the protozoa begin to regrow. Climate change, by accelerating such coral bleaching, thus constitutes a severe threat to reefs.
The usual way to study the health of coral reefs is for scuba divers to go down to the reefs and look at them up close. However, individual divers cannot cover a lot of ground. By one estimate, it takes two scuba divers up to 2.5 hours to examine 120 m2 of densely packed corals. Eric Hochberg, an oceanographer at the Bermuda Institute of Ocean Sciences and the principal investigator on the Coral Reef Airborne Laboratory (CORAL) project, likens the resulting sparse data sets to measuring the health of the great Pacific Northwest forests by taking a few one-hour hikes through them.
Effective remote sensing of coral reefs requires hyperspectral imaging or imaging spectroscopy, according to Hochberg. “You need a full spectrum at each pixel to do all the steps that are necessary to identify where on a reef there’s coral and where there’s not,” he says. Although some imaging spectrometers have flown in space, none has had the combination of spectral and spatial resolution that Hochberg was seeking.
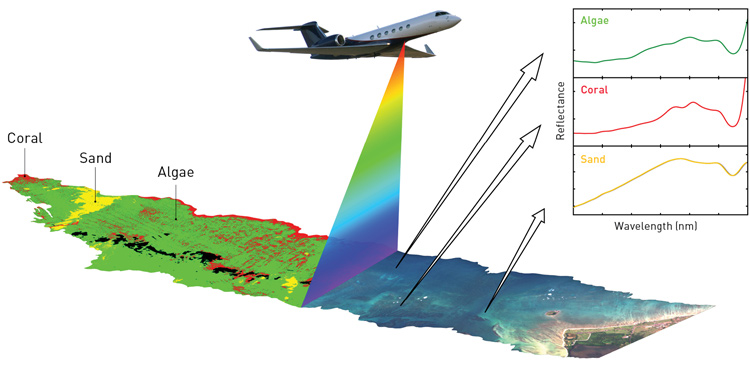 An illustration of how PRISM works. Each pixel has a continuous spectrum that is used to analyze the atmosphere, water and reef. [NASA Jet Propulsion Laboratory]
After years of applying to the U.S. government, in 2015 Hochberg got NASA funding to place a hyperspectral-imaging system, the Portable Remote Imaging Spectrometer (PRISM), aboard a Gulfstream IV jet and fly it above portions of the Great Barrier Reef of Australia, Hawaii, Florida, the Mariana Islands and Palau. His team performed the surveys in 2016 and 2017 and have been processing the data since then.
Michelle Gierach, CORAL’s project scientist at NASA’s Jet Propulsion Laboratory, USA, notes that OSA Fellow Pantazis Mouroulis led the development of PRISM, a descendant of JPL’s line of airborne imaging spectrometers going back two decades. According to Gierach, PRISM originated from the growing need for an instrument sophisticated enough to study the complexity of the coastal water column.
 International climate monitoring with IPAC and GEMM
OSA, through its four-year-old International Photonics Advocacy Coalition (IPAC), has made environmental monitoring one of the centerpieces of its strategy to increase global awareness of optical science. Inspired by the 2015 Paris Agreement on the mitigation of greenhouse gases, the IPAC team has organized the Global Environment Measurement and Monitoring (GEMM) Network to boost worldwide collaboration on photonic technologies for tracking the planet’s environmental health.
Thomas M. Baer of Stanford University (USA), the 2009 OSA President, is spearheading the IPAC effort, along with optical scientists from 11 countries. And while the program is international in scope, the committee members hope that the centers that will constitute GEMM will reflect regional concerns, from permafrost melting in the Arctic to groundwater contamination or air pollution in Earth’s warmer regions, says David Lang, OSA’s senior director of government relations.
“We wanted to see if there was some global effort that would resonate with just about every government,” says 2013 OSA President and Nobel laureate Donna Strickland, University of Waterloo (Canada), one of the IPAC members. “And the one that stood out was, in 2015, the Paris Accord.”
In September, the University of Strathclyde (Scotland, United Kingdom) opened the doors to the first GEMM center, which will provide doctoral-level training on the interplay between environmental photonics and the realms of economics and public policy.
“Our specialty here isn’t so much creating these technologies,” says Scott McGrane, a research fellow at Strathclyde’s business school. “It’s more using the data that come from these applications to better inform government policy and the economic models to understand the implications of future change.” McGrane and his colleagues attended last year’s GEMM meeting at Stanford, held in affiliation with the Global Climate Action Summit in San Francisco.
Although Canada has not yet formally created a GEMM center, Strickland notes that Québec’s Laval University, which has well-established programs in both photonics research and Arctic studies, has founded a transdisciplinary center called Sentinel North to study the country’s vast northern regions and develop technologies for future scientific efforts. According to Baer, IPAC is in active discussions with Sentinel North (which has a strong photonics component) to become a GEMM center.
PRISM performs “push-broom” scanning over the entire spectral range of 350 to 1050 nm, with spectral sampling of 3 nm and a 30-degree field of view. For accurate atmospheric and ocean color correction, the instrument includes a two-channel spot radiometer operating at 1240 and 1640 nm. During the CORAL mission, the aircraft carrying PRISM flew at an altitude of roughly 8500 m, yielding a resolution of 10 m per pixel.
Hochberg admits that the CORAL project, which ended in September 2019, provided a mere snapshot that needed to be cross-correlated with other information, such as satellite-based sea-surface temperature data and global water chemistry. He says the next phase of his research could go in either of two directions: he could perform hyperspectral imaging on reefs that have never been examined that way before, or reimage the reefs CORAL has already studied to see how they have changed over the last few years.
“Having a capability like remote sensing provides us with an ability to view much more of the coral reef ecosystem globally and provide a new dimension to that analysis,” Gierach says. However, remote surveys will always require in situ validation, by either scuba divers or, eventually, underwater autonomous vehicles.
Tracking an elusive molecule: ammonia
Ammonia in the atmosphere comes from vehicle emissions in urban areas and from fertilizers in agricultural regions. The NH3 molecules react with acids to form aerosol particles that affect Earth’s radiation budget and human health. Here again, a warming climate—which could increase the volatilization of ammonia and its concentration in the atmosphere—raises the stakes for keeping tabs on the problem.
Measurements of atmospheric ammonia, however, are surprisingly difficult. “Ammonia is a very sticky molecule,” says Mark A. Zondlo, an environmental engineering professor at Princeton University, USA. “If you bring the ammonia into a cell, it sticks onto every surface along the way.” Over the past decade or so, Zondlo and other scientists have developed portable spectrometers that employ mid-infrared quantum cascade lasers (QCLs), which can be set up in an open-path configuration aligned with a simple detector and sometimes a retroreflector. Open-path mid-infrared spectroscopy provides a wall-free area for trace atmospheric gases to flow without sticking to chamber walls, and the measurements of target-gas concentrations are integrated along the line of sight.
Zondlo has taken his open-path spectrometers to several U.S. locations such as Rocky Mountain National Park in Colorado, which sits on the Continental Divide. He and his colleagues are studying the ebbs and flows of ammonia from both the urban regions to the south and the agricultural plains to the east. He’s also designing a QCL spectrometer for studying nitrous oxide, a greenhouse gas that has a half-life in the atmosphere of 130 years, as opposed to 10 years for methane.
Still more innovation
These applications of photonics represent only a handful of the research projects—local, regional, global—that are quantifying the climate crisis and helping to mitigate the impact of climate change. Other optical technologies are finding their place in the urgent effort, too.
For example, Canadian scientists have begun to deploy fiber optic sensors for remote assessment of temperature-related changes in permafrost. Not only are these changes a marker of global warming, but also a safety issue: supply-plane pilots and ice-road truckers want to know about runway and road thawing, buckling and collapsing before embarking on trips. The technology, called distributed temperature sensing, first went into use in 2012, when a section of road leading to an airport in Nunavik (far northern Québec) needed major reconstruction. The multimode fiber temperature information correlated well with data from a parallel string of thermistors. Optical fibers also transmit the sensor data to researchers and road engineers.
Nearly 60 years ago, the leader of one nation, U.S. President John F. Kennedy, committed his country to a technological goal—landing humans on the moon—that would “serve to organize and measure the best of our energies and skills, because that challenge is one that we are willing to accept, one we are unwilling to postpone, and one which we intend to win.” As world citizens, many optical scientists are diligently focusing their efforts on what will likely be the defining challenge of the decades to come.
Patricia Daukantas is a freelance science writer based in Greenbelt, Md., USA.
For references, links to additional projects, and other resources, go to www.osa-opn.org/link/photonics-global-change.