
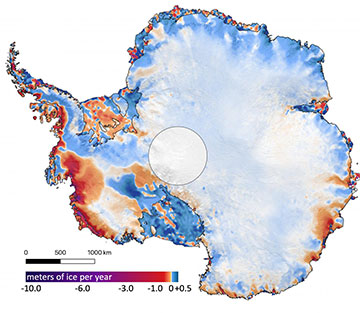
The amount of ice gained or lost by Antarctica between 2003 and 2019. The ice lost near the coasts, especially West Antarctica and the Antarctic Peninsula, outweigh gains in the interior. [Image: Smith et al./Science]
At 10,000 laser pulses per second, NASA’s space lidar instrument, Ice, Cloud and land Elevation Satellite-2 (or ICESat-2), has been measuring the height of our changing planet since its launch in September 2018. Now, a multi-institutional group of scientists in the U.S. have used those data to report on changes in the mass of the Greenland and Antarctic ice sheets over the past 16 years (Science, doi: 10.1126/science.aaz5845).
These represent the first results from the ICESat-2 mission—the most advanced Earth-observing laser instrument NASA has ever flown in space. According to the authors, the precision and high resolution of ICESat-2’s measurements allowed them to analyze the ice sheets’ response to changes in climate with unprecedented detail—revealing patterns and providing insight into future sea-level change.
Space lasers: Science nonfiction
ICESat-2, as its name implies, is the next generation of NASA’s first ice-measuring satellite mission, ICESat, which operated from 2003 until 2009. Both missions were designed to determine Earth’s ice-sheet mass balance, in addition to cloud property information and topography and vegetation data.
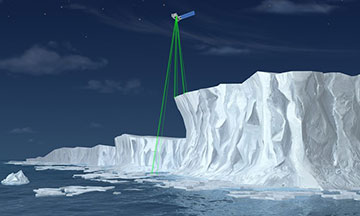
Illustration of NASA’s Ice, Cloud, and land Elevation Satellite-2 (ICESat-2). [NASA]
To achieve these goals, the spacecraft rely on a photon-counting laser altimeter system—space-based lidar. Essentially, the system bounces laser pulses off of Earth’s surface along the satellite’s track, which are then reflected back and collected by a telescope. Elevations are calculated by comparing how long it takes the photons to echo back.
After ICESat was decommissioned in 2010, NASA sought to upgrade its space laser technology for the follow-on mission. Whereas ICESat’s single-beam laser altimeter system fired 40 pulses per second of infrared and visible green light, measuring every 170 meters along the track, ICESat-2’s improved laser technology splits the single laser into three beam pairs, firing 10,000 532-nm pulses per second. The six-beam geometry, the researchers write, allow the system to measure the slope of the terrain in a single pass.
With this setup and at these speeds, ICESat-2 can take measurements every 0.7 m along its path—enough data points to estimate the annual height change of Greenland and Antarctic ice sheets to within 4 mm.
Tracking ice mass change
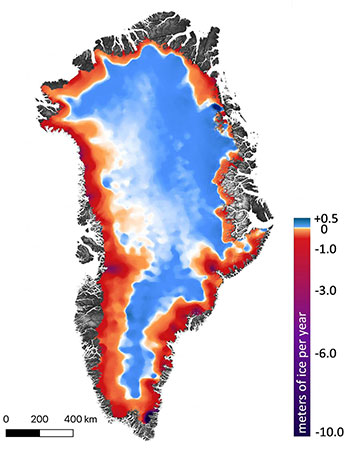
The amount of ice gained or lost by Greenland between 2003 and 2019. Dark reds and purples show large rates of ice loss near the coasts. Blues show smaller gains in the interior. [Image: Smith et al./Science]
In the latest study, the researchers, led by Ben Smith at the University of Washington, USA, took overlapping laser altimetry data from the ICESat and ICESat-2 missions and compared them to determine changes in Earth’s ice sheets over a 16-year time period. To do this, the researchers overlaid the denser tracks of ICESat-2’s measurements on top of ICESat’s sparser tracks, and found where the data sets intersected. Only these data—representing tens of millions of sites—were used in their calculations.
Next, the team applied several corrections to convert from height to mass change, including a customized correction for firn (partly compacted, granular snow that hasn’t yet become glacial ice), isostatic adjustment (the tendency of the underlying land mass to “bounce back” or rise somewhat as the weight of the glacier decreases), elastic compensation of the Earth’s surface, ocean tides and inverse barometer effect. The result was a combined estimate of total ice-mass losses and gains from both ice sheets.
According to the researchers, by pulling from 16 years of data on just one metric—elevation change—over the exact same geographies, they were able to analyze ice-mass changes in unprecedented detail. In previous studies, they write, resolving differences in instruments, methodologies and study periods have made mass changes more challenging to estimate.
Sea-level projections
According to the researchers results, ice losses (due to surface melt and ocean melting of the ice sheets) far outpaced gains (caused by snow accumulation). The team found that Greenland’s ice sheet lost an average of 200 gigatons of ice per year, while the Antarctic sheet lost 118 gigatons. Together, the team writes, these ice losses are responsible for 14 mm of sea level rise between 2003 and 2019.
Based on their unified estimates from the two lidar satellites, the scientists write, in the future “we can expect increasing contribution from both Greenland and Antarctica to sea level rise on relatively short (decadal to centennial) time scales.”